

Smarter Data. Better Decisions.
We help organizations automate manual data work and turn their data into clear, actionable insights.
Data clarity drives real impact.
When data lives across spreadsheets, systems, and manual processes, it becomes harder to trust and harder to use. Teams often spend more time cleaning, reconciling, and recreating reports than actually using data to make decisions.
Without clarity, important questions go unanswered:
Who are we serving?
What products, services, or programs perform best?
Where are people coming from?
What’s driving participation, engagement, or sales?
For many organizations, clarity also depends on asking the right questions . Whether that’s understanding customer behavior, family needs, service usage, or community engagement.
When data is organized, automated, and clearly presented, it becomes a tool, not a burden.
Clear data helps teams understand trends, identify opportunities, and make confident decisions.
Based in the Rio Grande Valley, we partner with local organizations and small businesses to turn everyday data into meaningful insights, while supporting teams beyond the region as well.
That’s why we take a thoughtful, step-by-step approach to every project.
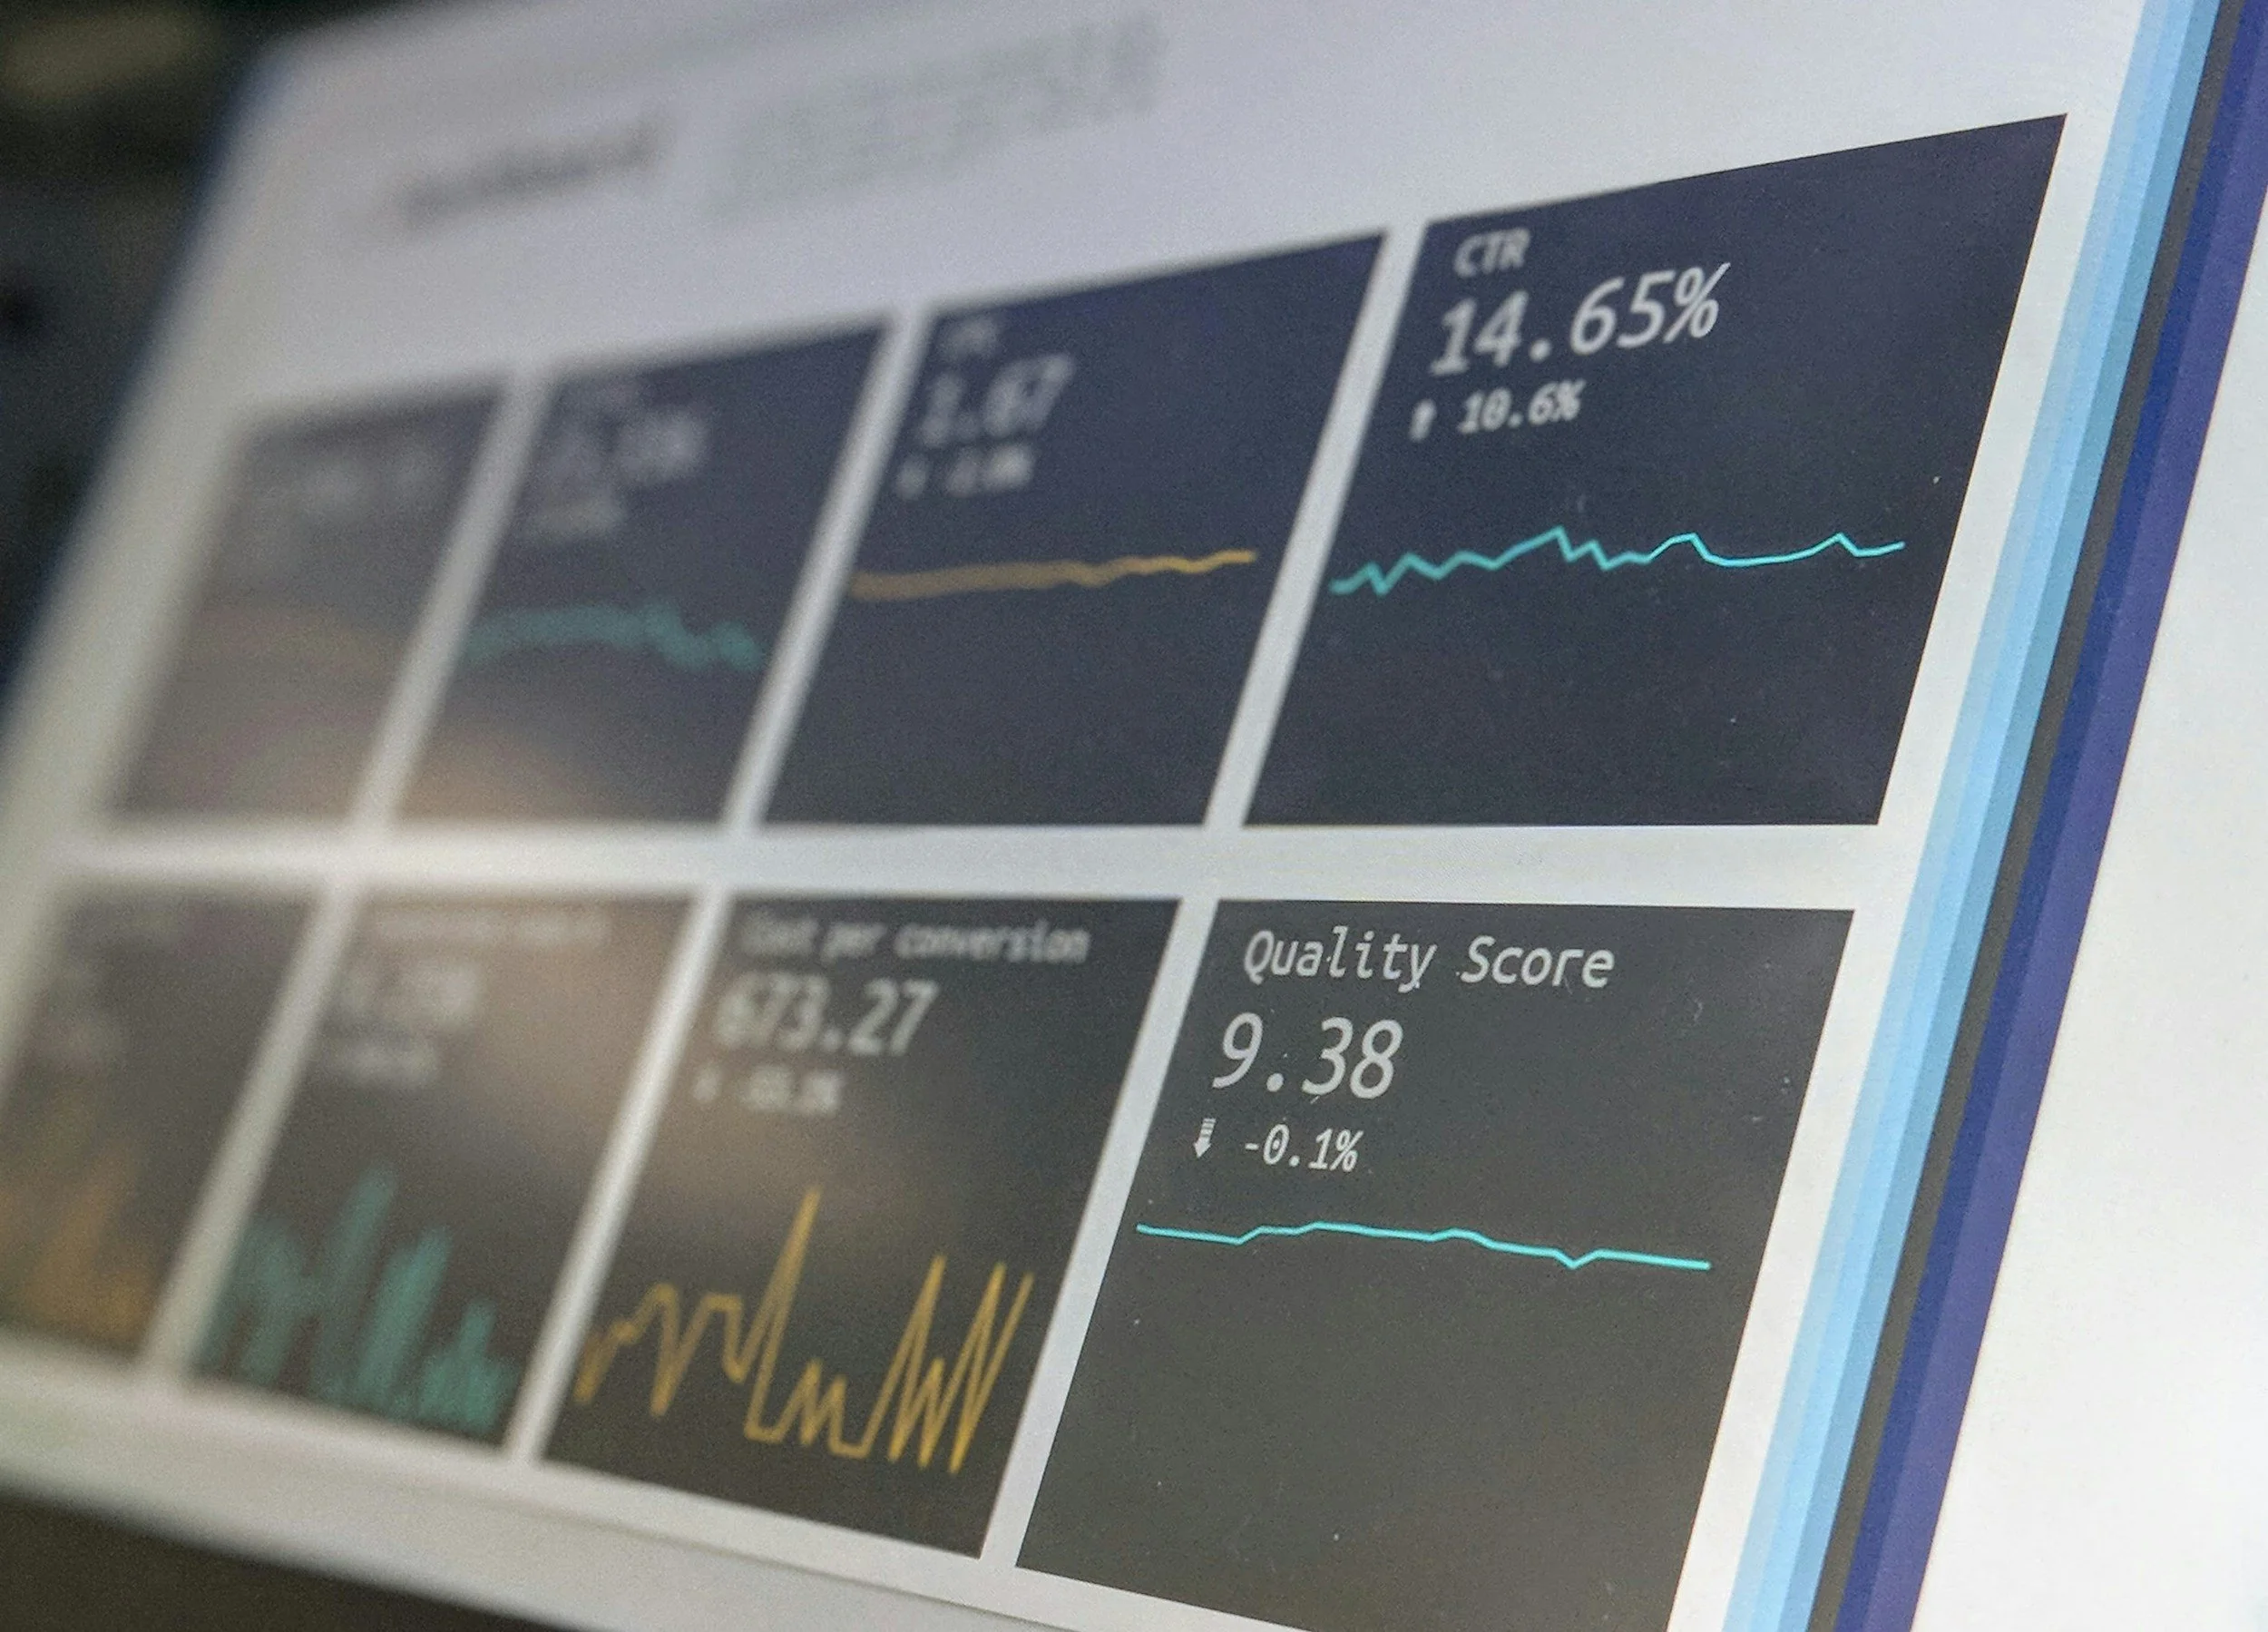
Our Approach
1. Understand
Your workflow and how your data is currently used
2. Identify
Opportunities to reduce manual work and improve clarity
3. Design & Build
Automation tailored to your tools and needs
4. Deliver
Clear reports, dashboards, or summaries your team can confidently use
Our goal is to simplify your data processes and help you get more value from your data.
Our services
-

Data & Reporting
Clean, organized data and reliable reports that make everyday decisions easier.
-
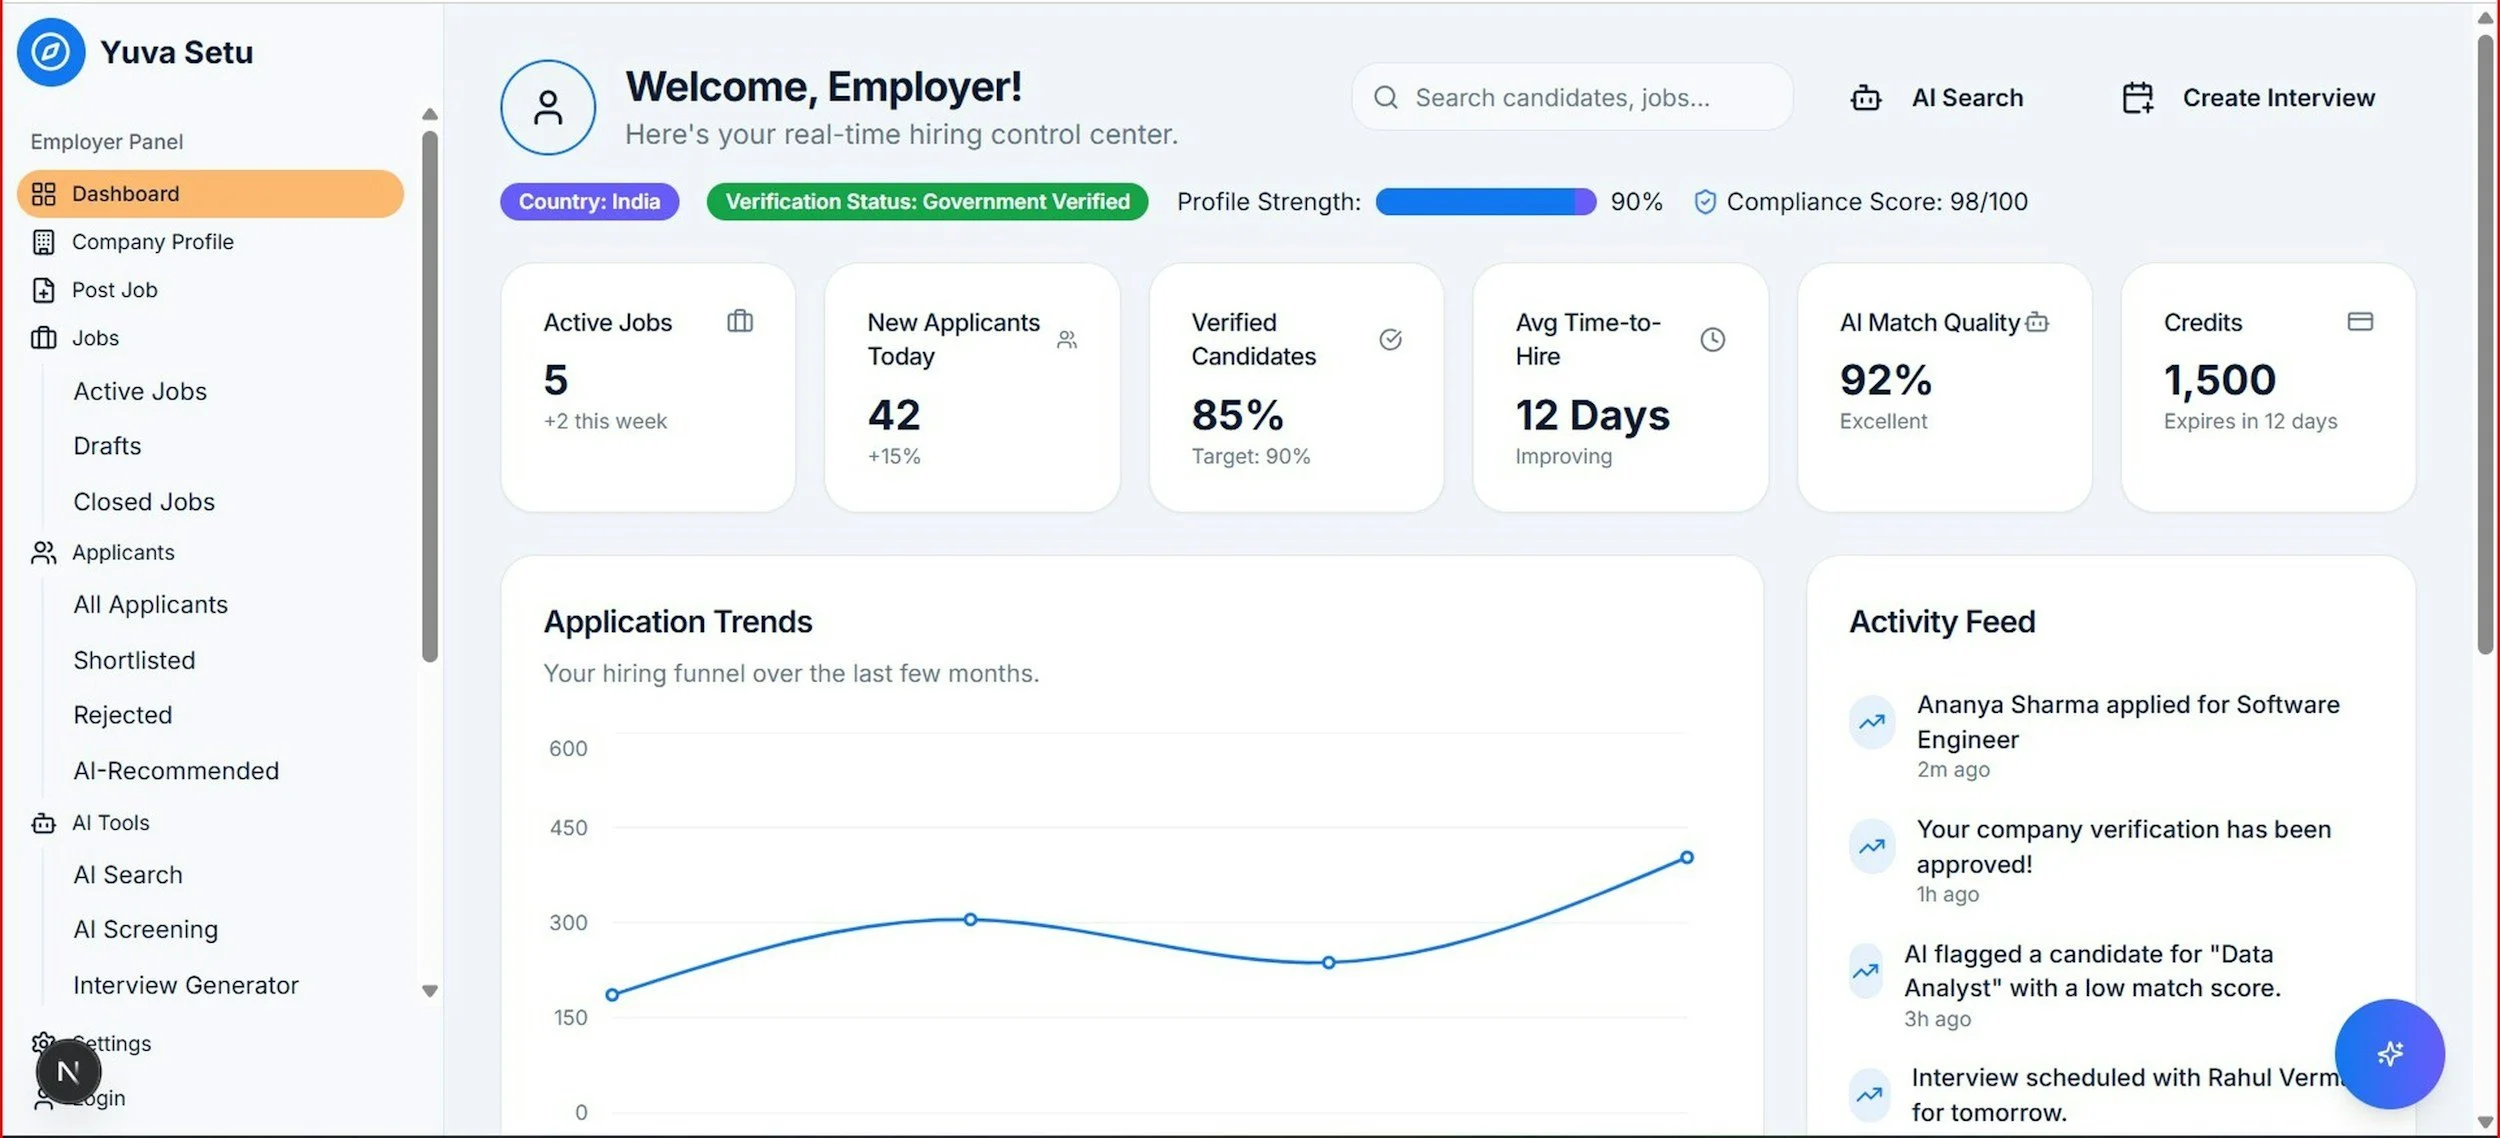
Dashboards
Power BI and visual reports that bring your key metrics together in one clear view.
-
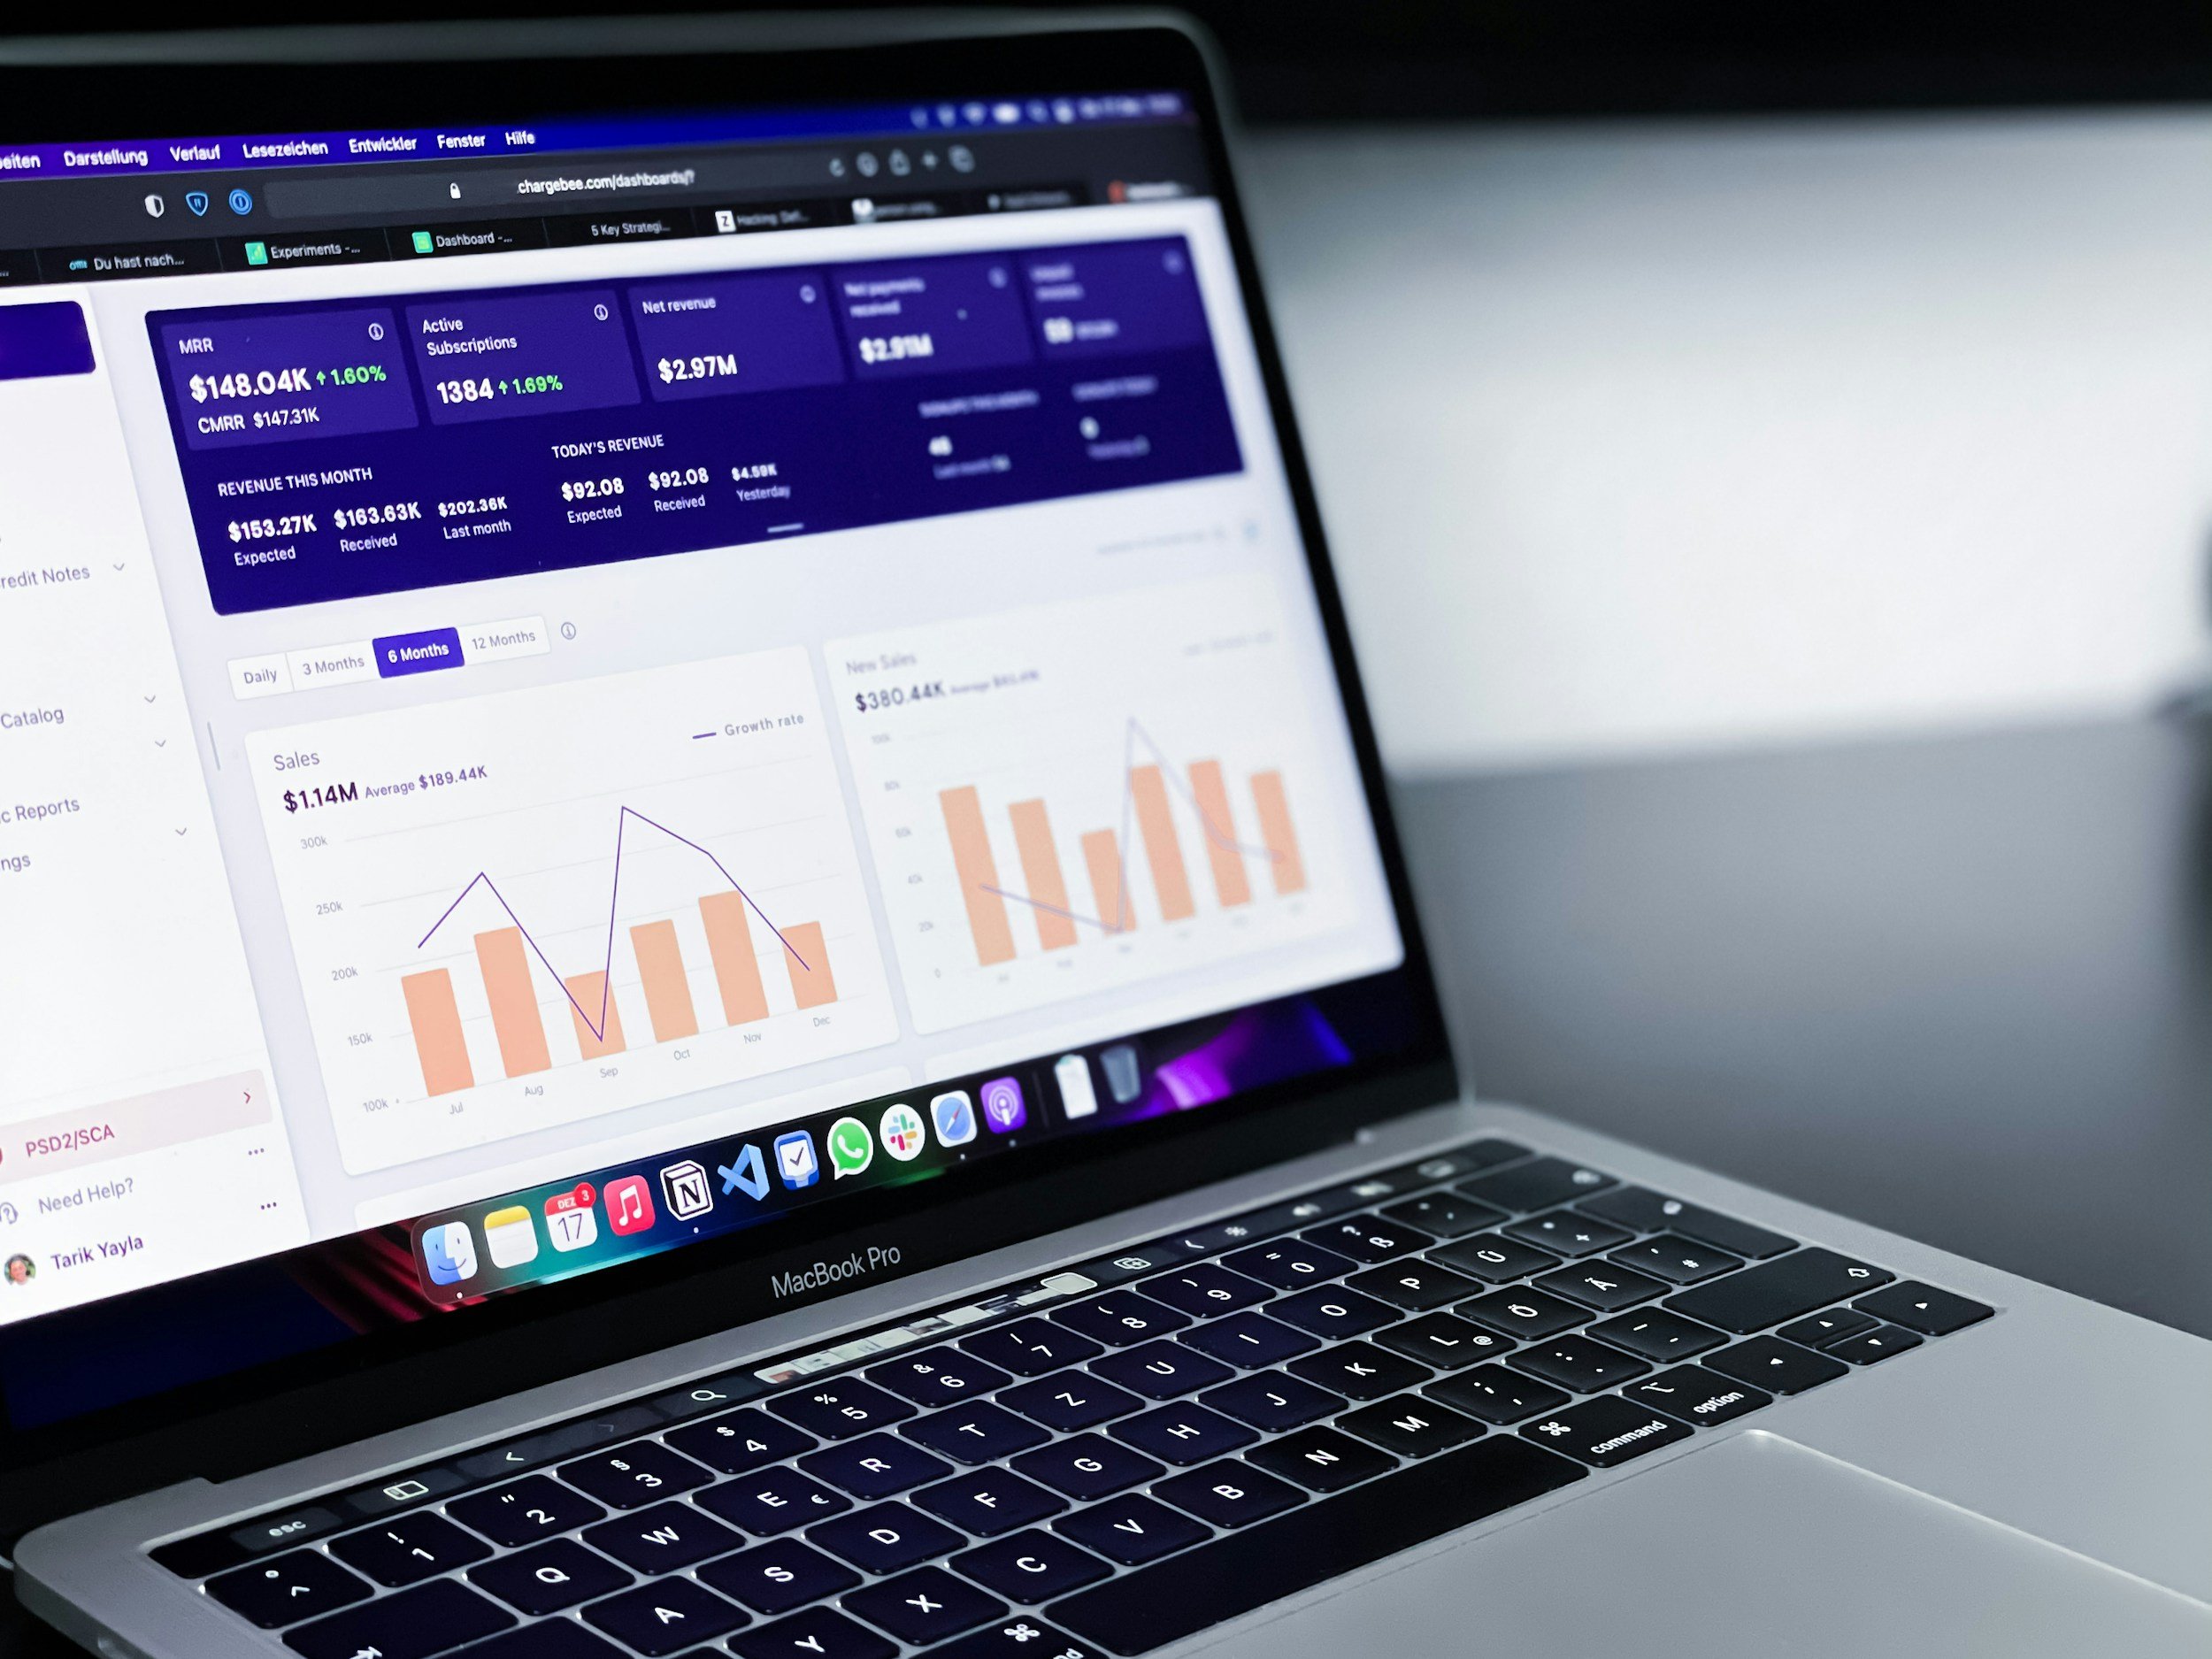
Automation
Excel, Microsoft 365, and custom workflows that reduce repetitive tasks and manual reporting.
-

Consulting
Practical guidance for compliance reporting, better processes, and the tools your team already uses.